PRISMTM is our in-house AI engine. It gives ClarityTM the ability to automate nearly all the aspects of multifinger caliper processing, delivering reliable and repeatable results with the click of a button.


Lorem ipsum dolor sit amet, consectetur adipiscing elit. Ut elit tellus, luctus nec ullamcorper mattis, pulvinar dapibus leo.
During 2025 Clarity saw 4 major updates, each delivering new features and major performance enhancements. We closed the year with Clarity V1.4 delivering enhanced productivity and enabling users to do even more with their downhole data.

V2 represents the biggest step change in both performance and capabilities for the Clarity platform. It brings some of our most advanced PRISM modules to the end-user for the 1st time, including our finely-tunned LLM for fully automated report writing.
The quality of your input data directly affects the accuracy and reliability of the insights or results derived from it.
One the most important lessons an analyst learns is how to thoroughly check a data set for issues arising from such things as well condition, well deviation and tool performance.
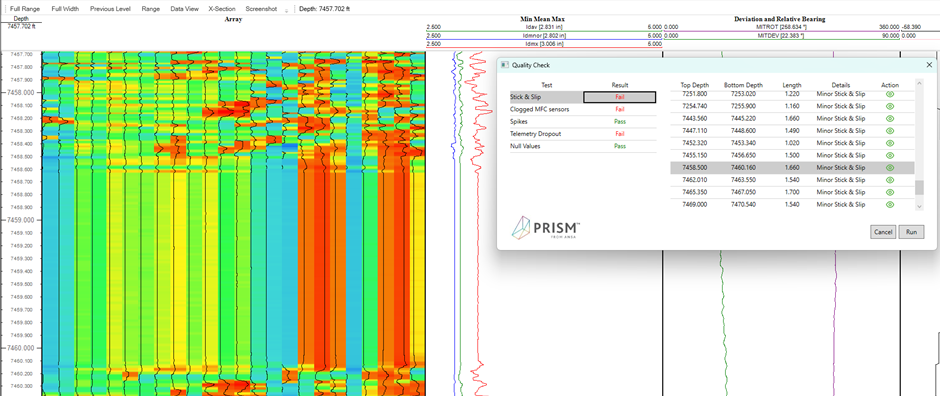
PRISM Data QC, using heuristics and hierarchical statistical methods, highlights depth ranges in your data which could impact your ability to answer the survey objectives.
An automatically generated report flagging any zones of concern is an invaluable place to start when you begin processing multi-finger caliper data.
Centralisation is crucial for accurate calculation of penetrations to the tubing wall and often involves a balanced approach to avoid excessive processing time on one aspect of the processing workflow.
Without PRISM Centralisation, the analyst would select one mode of centralisation for the whole survey, quality check their effort before deciding whether to proceed with the rest of the analysis or perhaps try other methods.
If one mode does not work throughout the whole data set splicing several methods of centralisation together is also a possibility when working without PRISM Centralisation. This takes more time and introduces more room for user errors.
In surveys, contain high inner radius and low diameter features (e.g., metal loss and deposition) centralisation using all radial values can result in processing artefacts being introduced, which need to be explained away in a report.
PRISM Centralisation scans every depth frame of the data set making the best choice of centralisation method throughout the caliper survey. This is a process that would be impossible for a human to replicate.
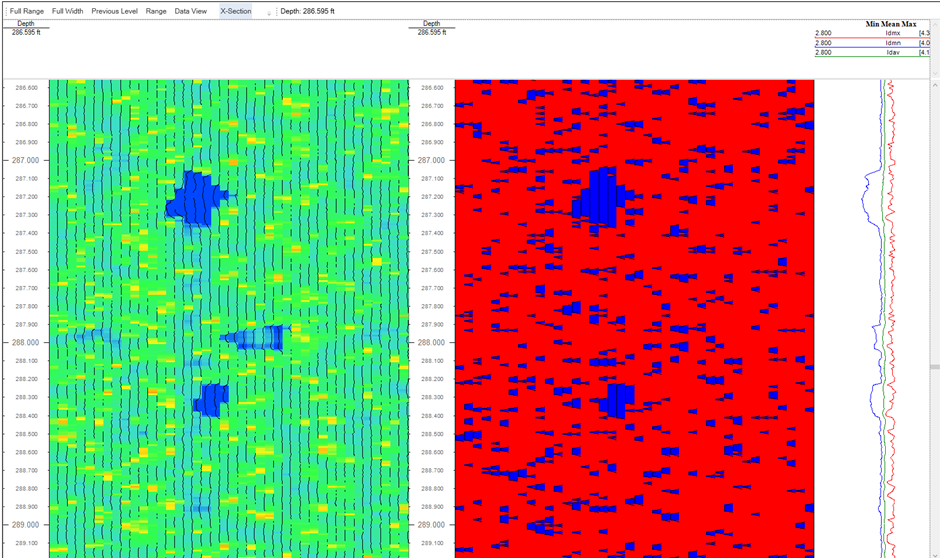
Left hand side is the multi finger caliper data. Right hand side if a map that displays the data from each arm that is being excluded to get the best centralisation result.
The task of joint detection can take hours with alternative software, now takes minutes with PRISM.
It takes just one click to find and exclude connections from the survey results. Other software requires the user to define detection parameters to help detect the connections, which adds time to the overall process.
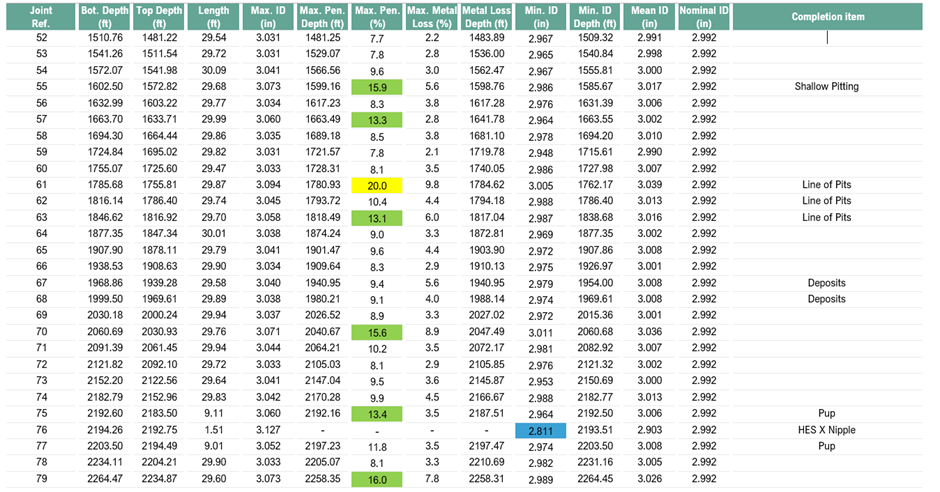
To enable calculation and reporting of statistical values based on the recorded data and tubular nominal dimensions, analysts can now use parameter-free PRISM Joint detection.
Machine learning allows users to isolate tubing or casing connections which could otherwise report as misleading metal loss features, making the analysis of the tubing body harder.
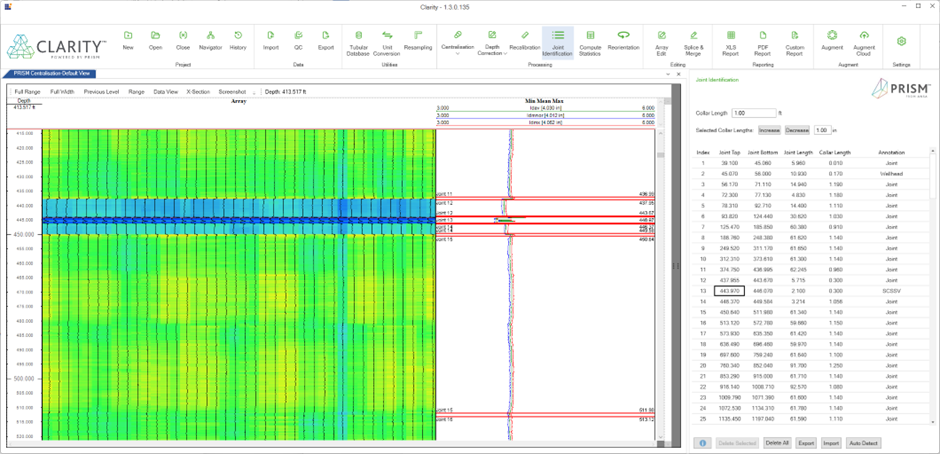
Right hand table is the auto detected joint tops and bottoms, completion items are also detected and (some of them) are named by Clarity.
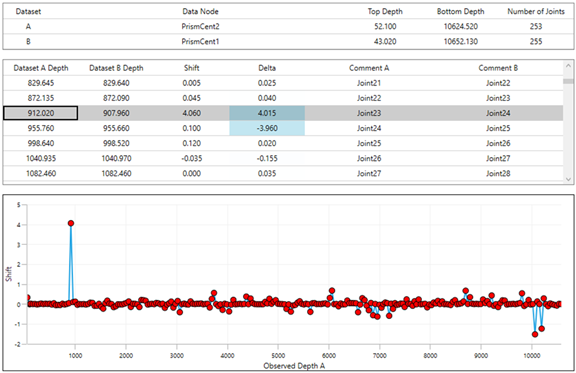
Matching the survey depth record with a reference document such a well schematic is essential for several reasons. It allows comparison of dissimilar surveys, the same survey type in the same well across time and to inform depth correlations on future well interventions using the same conveyance.
To do complete depth correction, the analyst must spend time finding completion items (e.g., SSVs, SSDs) in a well schematic or tubing/casing tally and in the survey data so they can return the data to schematic quoted depths.
Combining three powerful modules (Downhole Item Identification, Joint Identification, Assisted Depth Correction) you can now have Clarity™ scan the data and suggest to you the required depth correction. This replaces the manual process of scrolling through the data, matching the acquired depths with the reference depth and calculating the depth corrections.
The well schematic is read by PRISM Assisted Depth Correction and the reference depths of completion items such as safety valves, gas lift mandrels, tubing crossover etc. are extracted.
PRISM Downhole Item Identification automatically finds all the completion items in the survey data. It reports the depths of these items, which gives an analyst the input and output depths, allowing Clarity™ to report the depth correction pairs that are required to shift the data to the depth reference.
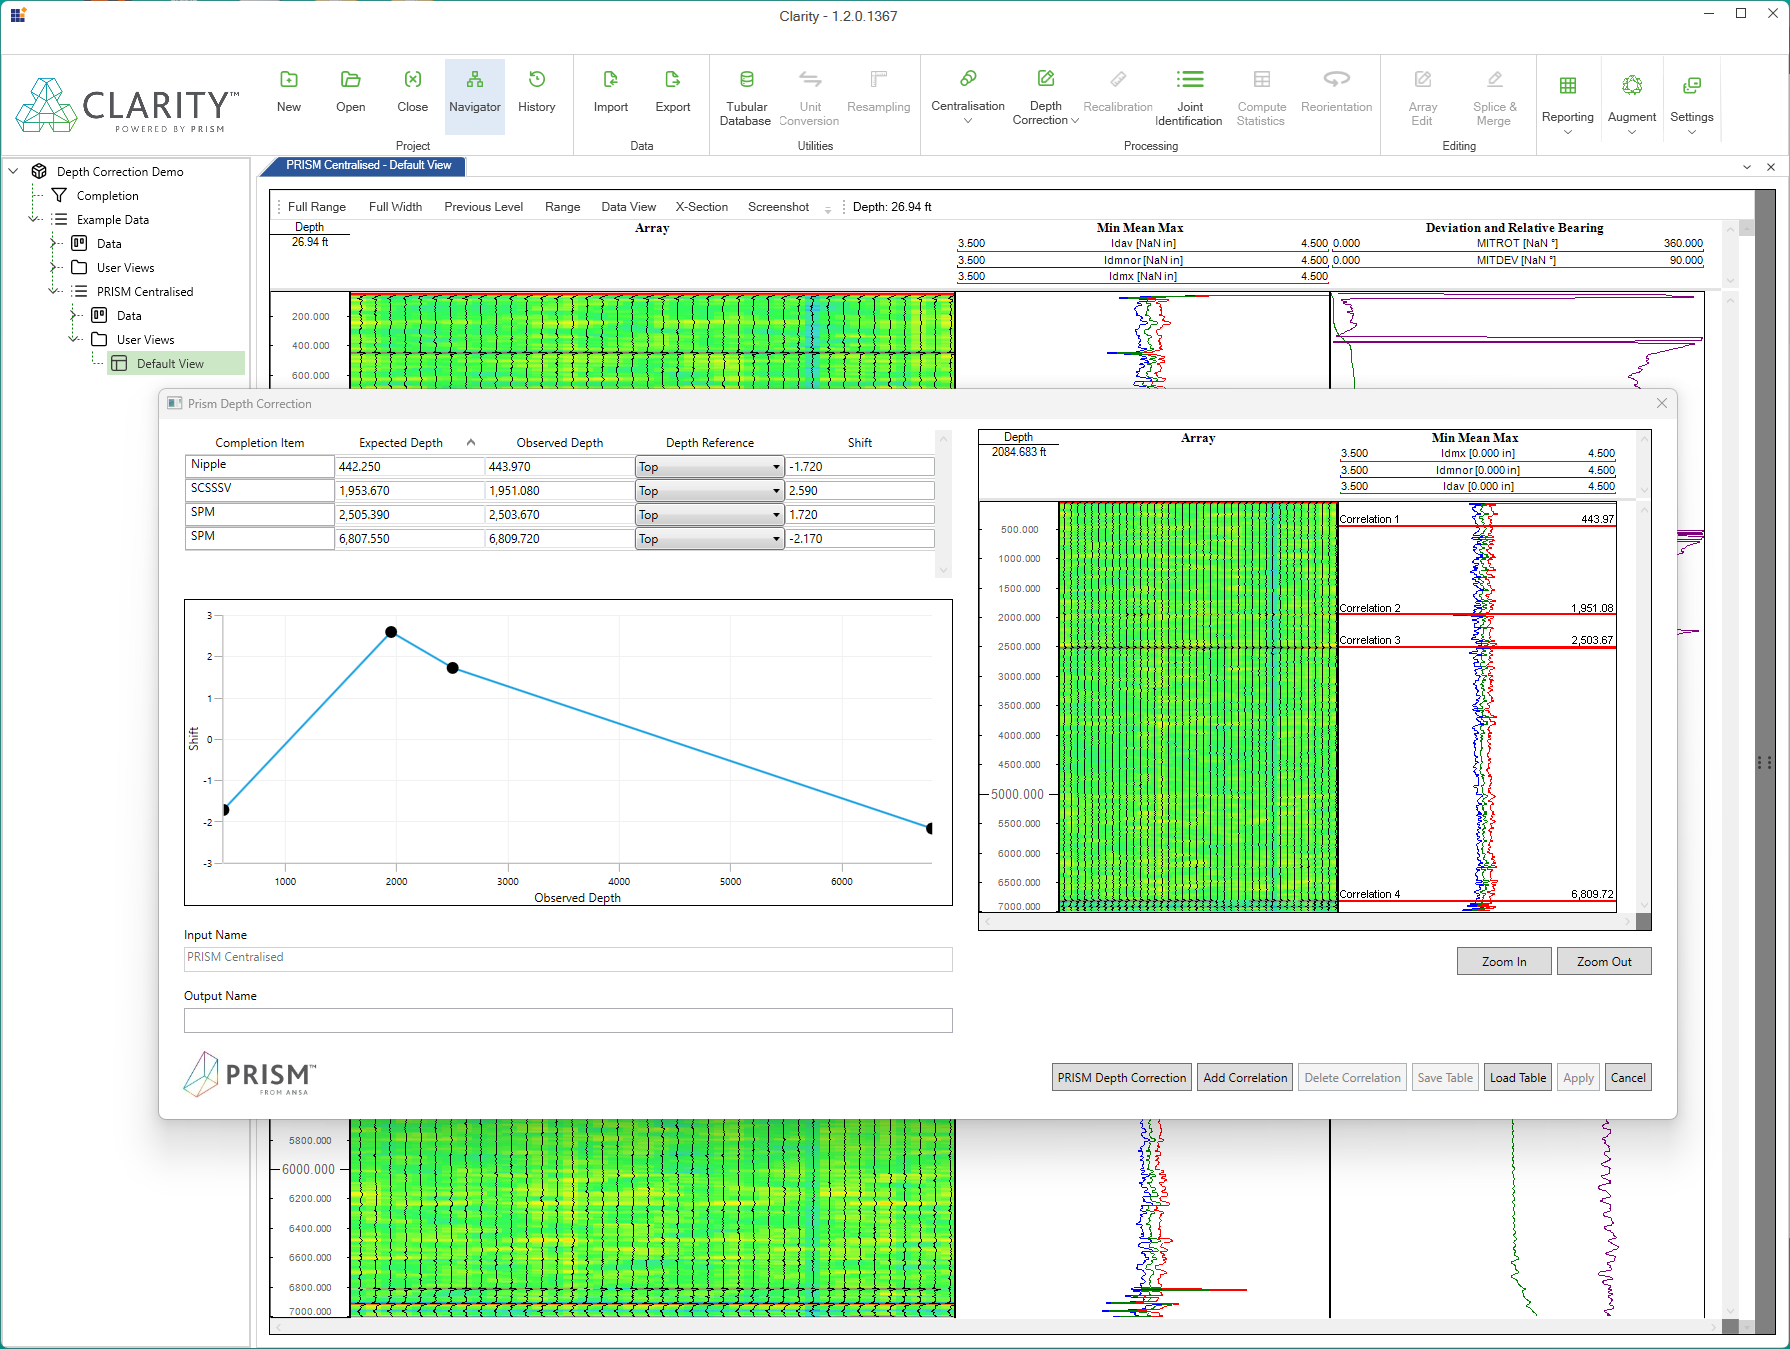
Top left is completion information entered by the user paired with those completion items found in the data set by Clarity. Right hand side is an image of the caliper data with a red adjustable marker at each depth correction point.
Several downhole forces can lead to deformation of the tubing or casing: mechanical stress during handling and installation, formation movement, pressure and temperature differentials and cyclic loading and unloading are some of these causes.
The presence of deformation is processed out whilst correcting for decentralisation of the toolstring. Therefore, the analyst has to inspect the raw data for indications of pipe deformation.
PRISM Deformation Analysis inspects the data for recognisable responses to automatically highlight deformed pipe and reports on restriction diameters and maximum drift lengths.
Comparing multifinger data sets in the same tubing or casing over time gives the well owner valuable information: The comparison helps to identify changes in deformation, wear and corrosion features that occurred between the two surveys allowing the operator to plan for maintenance and repairs.
The two data sets must be on depth with each and the reference. Processing steps used in each data set should be confirmed to ensure that no unwarranted edits have been applied. If the analyst is presented with two processed data sets with no history they may have to assume no change at particular down hole items and recalibrate the data set to allow a comparison.
This module helps Clarity automatically detect completion items and connections and puts the two data sets on depth with each other. If Clarity was used to process both data sets then the processing history will be analysed to ensure that similar methodology was applied.
Statistical values to describe the evolution of any loss features, deformation or deposition can then be created. The addition of several charts and tables to illustrate the changes over time are then available to be added to the custom reporting stage.
Occasionally, the analyst will be presented with a survey where the recorded values will have been altered due an external factor: perhaps high well temperatures and a lack of temperature compensation for the tool, or the hardened fingertips have worn completely, in which case the metal of the arm can wear quickly, causing the radius values from this arm to be higher than expected. At times, it might also be necessary to replicate processing methods from an older survey to allow a time lapse comparison.
Experienced analysts can create the required shift values from the correct log intervals to adjust for these effects. However, it’s a time consuming process. PRISM Recalibration will allow all user to reach the same results within seconds
It takes an analyst time and experience to be able to take a correctly processed data set and describe the visual representation of the features to the audience in a timely manner.
Being able to maximise your time and deliver maximum value to your customers by prioritising which features to describe in text and images in your report is important. Quite often, a compromise is reached as not every single feature will be described in the same level of detail.
For each joint and for each identifiably unique feature PRISM Damage Classification provides descriptive terms to let the audience understand exactly what is happening at every point in their well, differentiating between wear, corrosion, deformation, and deposition at every depth. With PRISM Damage Classification there is no need to compromise by only describing the maximum penetration value when Clarity™ can describe as many as you want to include in your report.