

Bringing the user more ways to save time and achieve better results, in the latest version of Clarity we have our first version of two exciting new modules.
PRISM Data QC v.1
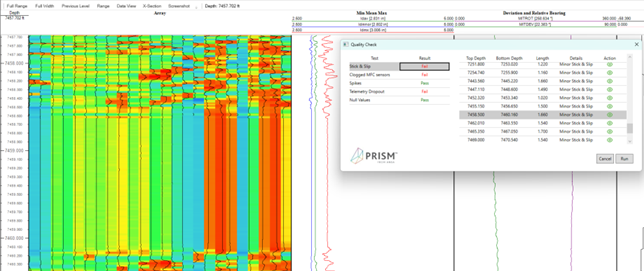
Using heuristics and hierarchical statistical methods Clarity highlights depth ranges in your data which could impact your ability to answer the survey objectives.
Stick and slip, a term used to describe the irregular tool string motion often caused by friction of the wireline/slickline, can mask the presence of features and their apparent lengths. Periods of a single data points being stretched out (tool stick) alternate with intervals with what appears as compressed data points over a short length (tool slip). Depending on the severity of the stick and slip, analysis of these intervals can be compromised and Clarity can flag these intervals for you.
Clogged MFC sensors. Debris can clog the arms of the multifinger caliper resulting in low radius values. This is a useful interpretation point as the presence of mobile debris can be of relevance and importance. However, clogged arms make it harder to obtain representative minimum diameters, therefore knowing where the arms are clogged is necessary to better consider how to treat these zones.
Spikes. Erroneously high values characterized by a rapid change in individual arm readings, possibly caused by tool malfunction, will hinder analysis of the real high ID values in the tubing body. PRISM QC lets you zone out these regions for edits to quickly exclude these misleading values.
Telemetry Dropout. Various electrical factors and mechanical issues can cause misleading high and low values to be recorded in your data set. Clarity can help you to identify these so you can get the most value from your data set quickly by editing them out or, if they are not in your zone of interest you can move on and answer your ‘quick look’ objectives with confidence.
Null Values. Quickly highlight depth ranges which have null or NaN values instead of real recorded radius values. This allows you to exclude these regions from analysis.
To find out more about Clarity, get a free trial and a demo, get in touch with our team by using this contact form.
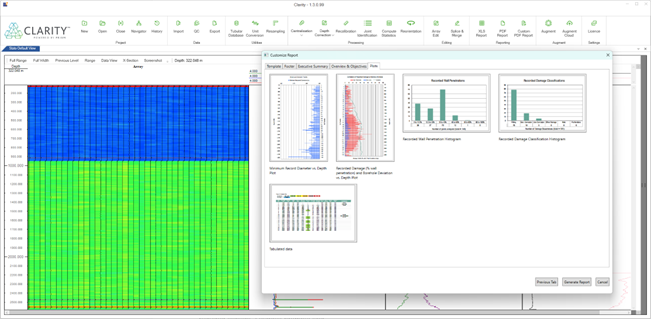
When you need to present your findings, you also must lay out the text, graphics, charts, and tables in your own branded material that is both easy to comprehend and sets your product apart.
Up until now automatic reporting has been limited to using a basic, white label style output. With Clarity you can use your own branded Microsoft Office document template which is set up with ‘mail merge’ style prompts for Clarity to automatically populate the report with the required content.
Example prompts could be:
If you have a Microsoft document template already, ANSA experts can work with you to insert the prompts so that you can get up and running as quickly as possible.
Version one of Customised Reporting is only the beginning, get in on the ground level now to have your say in what we add next. We have some exciting ideas…
If you’d like to request a demo of Clarity™, get in touch with our team.